Every Line Tells a Story — Learn to Read Stock Charts Like a Market Pro
Ever looked at a stock chart and felt lost in the lines, candles, and colors? Don’t worry, you’re not alone. For beginner investors, stock charts may seem like rocket science at first. But once you understand how they work, you’ll unlock the true power of technical analysis and spot stock trends like seasoned traders.
In this beginner-friendly guide, we’ll break down everything you need to know to start reading stock charts confidently and make smarter, more informed investing decisions.
What Are Stock Charts and How Do They Work?
Stock charts are visual tools that display how a stock’s price moves over time. They help investors analyze patterns, trends, and signals that influence buy/sell decisions.
These charts can show:
- Daily price movements
- Historical highs and lows
- Opening and closing prices
- Volume of shares traded
The most commonly used types include:
- Line Charts: Simple and easy to understand. Great for spotting general price direction.
- Bar Charts: Show open, high, low, and close prices.
- Candlestick Charts: Popular in technical analysis, these reveal price movement and sentiment using “candles.”
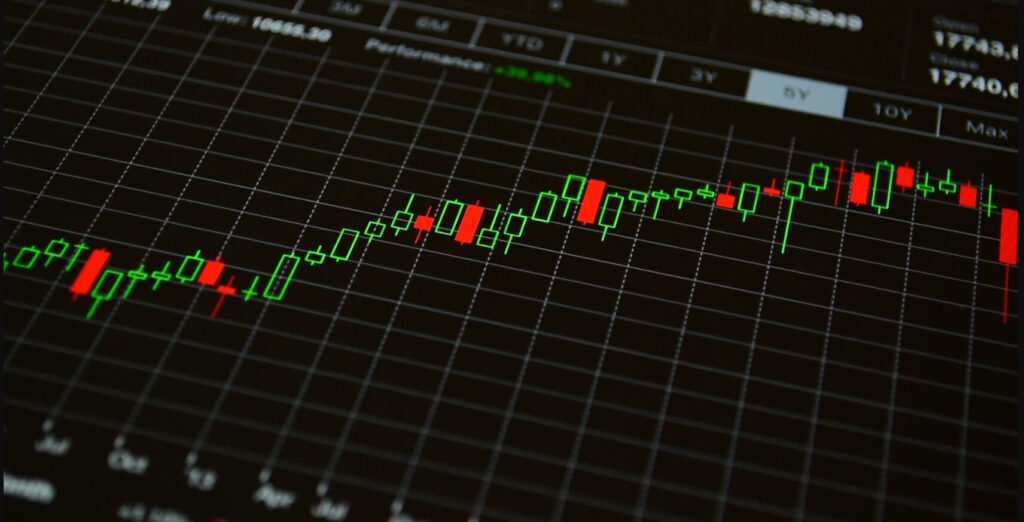
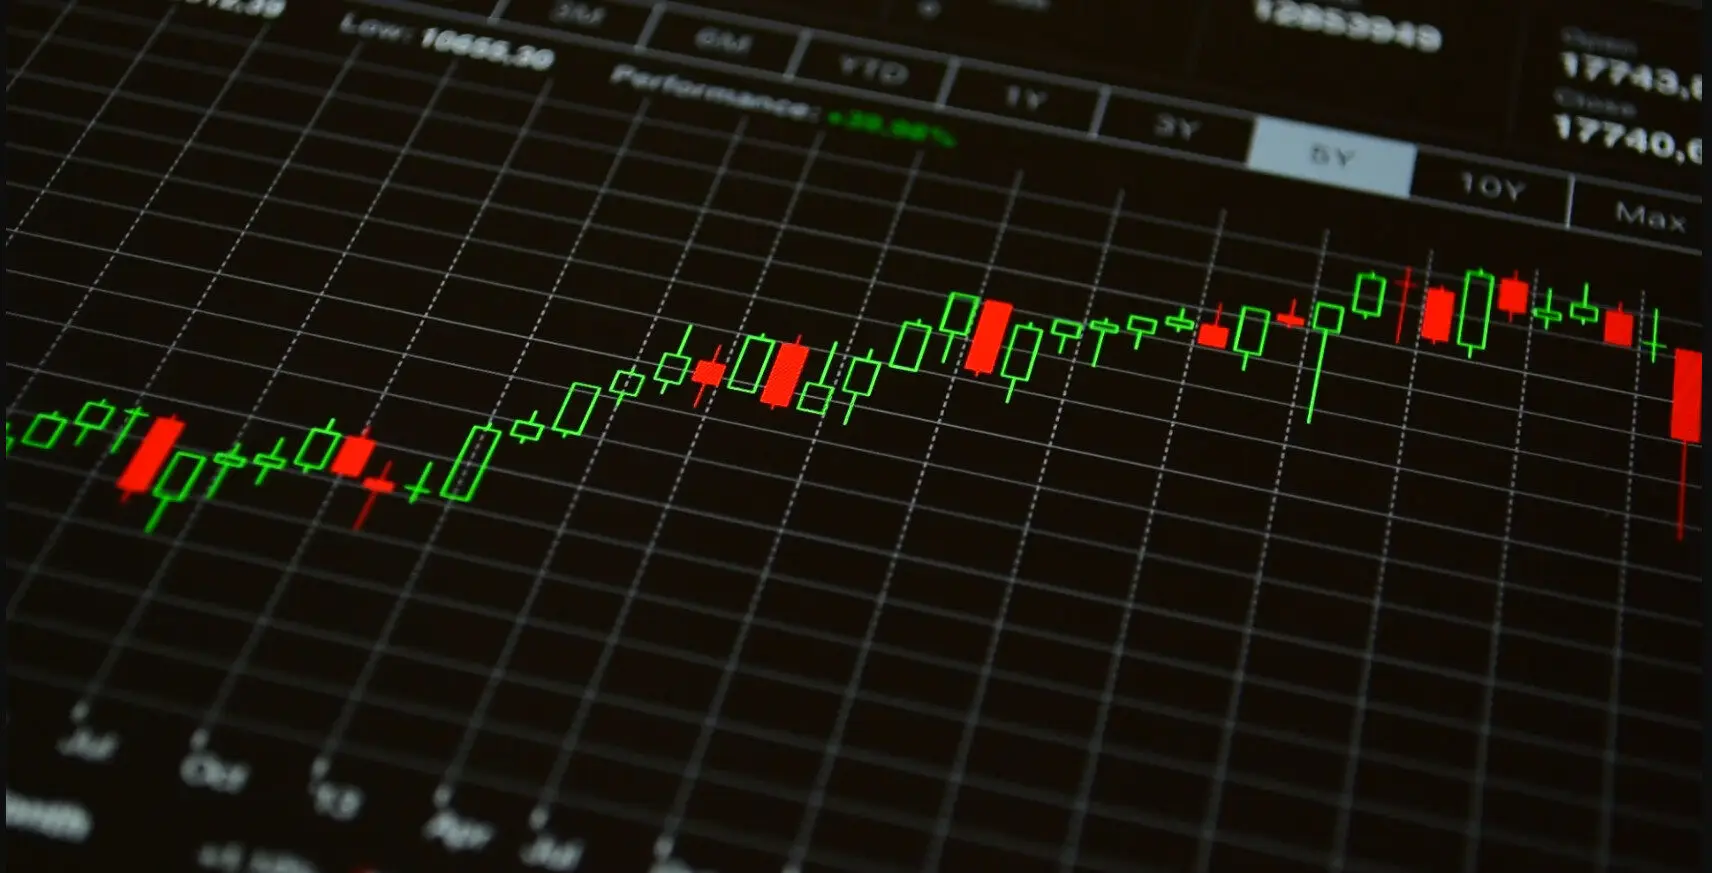
What Are Candlestick Charts?
Candlestick charts are the go-to format for traders and investors who want to visualize stock price movement with more detail. Each “candle” represents price data for a specific time frame.
- Green Candle = Price went up
- Red Candle = Price went down
- Wick (shadow) = Highest and lowest price
- Body = Opening and closing prices
Understanding basic candlestick patterns like dojis, hammers, and engulfing patterns helps predict possible stock trends.
How to Identify Stock Trends Using Charts
Recognizing trends is the key to successful trading or investing. Stock charts help you answer:
- Is the stock in an uptrend (making higher highs)?
- Is it in a downtrend (making lower lows)?
- Or is it in sideways consolidation?
To identify trends:
- Use trendlines to connect highs or lows
- Look for moving averages to confirm momentum
What Is Technical Analysis?
Technical analysis is the practice of using past price and volume data (shown on charts) to forecast future movements.
Some popular technical indicators include:
- Moving Averages: Show average price over a period to smooth out volatility.
- RSI (Relative Strength Index): Measures momentum; above 70 = overbought, below 30 = oversold.
- MACD (Moving Average Convergence Divergence): Helps spot changes in trend strength and direction.
- Volume Analysis: Confirms if price movement is supported by strong investor activity.
Each of these plays a unique role in helping beginners understand when to enter or exit a trade.
🔎 How Do Beginners Read Technical Charts?
Start simple. Follow this 4-step framework:
- Choose the Right Chart Type: Use candlestick charts for more insight.
- Look at the Trend: Draw trendlines and observe if the stock is going up or down.
- Use Basic Indicators: Start with moving averages, RSI, and volume.
- Spot Support and Resistance: Identify key price levels where the stock often bounces (support) or falls back (resistance).
👉 Pro Tip: Combine chart patterns with technical indicators for higher accuracy.
❓ Frequently Asked Questions (FAQs)
1. What is the difference between candlesticks and line charts?
- Candlesticks provide more detailed information: open, high, low, and close.
- Line charts only connect the closing prices.
2. Can you predict stock trends with technical analysis?
Not always with 100% accuracy, but yes, technical analysis helps estimate stock trends and likely price behavior based on historical data.
3. Which chart is best for stock trading?
Candlestick charts are preferred by most traders due to their visual clarity and pattern recognition.
4. What are some technical indicators beginners should use?
Start with:
- Simple Moving Averages (SMA)
- RSI (Relative Strength Index)
- MACD
- Volume analysis
Best Charting Tools for Beginners in India
If you’re looking to practice reading stock charts, check out:
- TradingView (Free + paid versions)
- Moneycontrol (Basic but handy)
- Groww & Zerodha Kite (For real-time charting)
Tip: Stick to daily and weekly charts when starting. Avoid 1-minute or 5-minute charts; they’re too fast for beginners.
Chart Smarter, Not Harder
Reading stock charts isn’t just for experts or day traders. With a little practice, anyone can master the basics of technical analysis and identify meaningful stock trends.
Whether you’re analyzing a simple line chart or diving deep into candlestick patterns, the goal is the same: to make data-driven decisions that improve your investing results.
Start slow. Focus on understanding patterns, using simple indicators, and building your confidence. Before long, you’ll be reading charts like a pro even if you’re still a beginner.


Leave a Reply